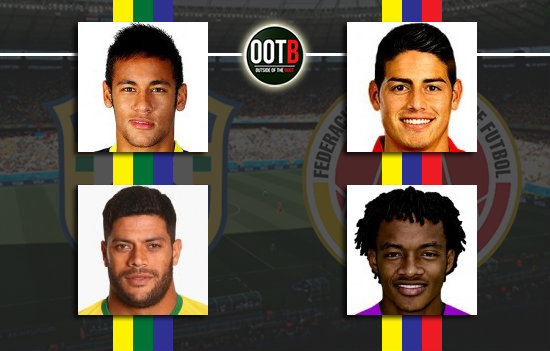
As we enter the latter stages of the World Cup and into what will turn out to be some of the most historic games of the tournament, we will statistically analyse some of the key players of each team based on the systems employed & opposition using Squawka‘s excellent comparison matrix.
Don’t miss | France vs Germany –> 3 Key Questions –> Combined XI
Comparing the attacking heads
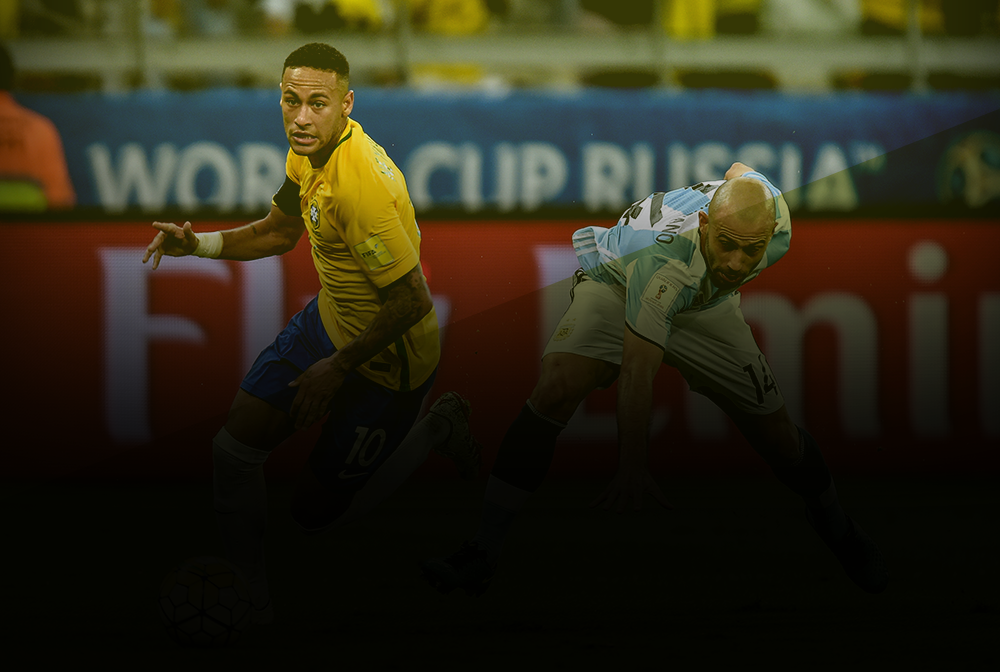
Following his transfer to Barcelona last summer, big things were expected of him at both levels, club and country. Massive pressure was heaping on his shoulders and it would be very harsh to say that his domestic season was a bad one. So far, Neymar has carried the weight of a quite disappointing Brazil side in terms of performance. Brazil, evident with a lack of threatening strikers, will look to this 22 year old to keep up his form and carry them forward.
A time that could see Colombian football rise again after their slump in the 2000s, Monaco’s James Rodriguez has become the name and face of this new Colombian team in this World Cup following some stunning goals.
Both players will be considered the focal point of their respective team’s attack. With modern players being given a more free role to shrug off being effectively man marked, the two no. 10s’ movement will be crucial to the way their team performs. Neymar’s performance will be essential with respect to how the Brazilian strikers fair.

Playing fewer minutes, James does have a better goal average at 1.25. But this doesn’t cover the whole picture. Neymar’s involvement in the game specifically at crucial times can be seen, having more chances created in each game as well as having more key passes than James.
James’ attacking mindset is a lot more prominent with more forward passes, 24.50 per game to be exact, fewer backward passes, greater shot accuracy (an impressive 88%) and more long range shots than Neymar. This is evidence of the more direct approach that the Colombian has taken (for further evidence, read below).
Defensively, James has contributed more, bringing up more blocks, winning more tackles and having more clearances than his no. 10 counter part. Frankly, these contributions by both players are minimal and irrelevant since we are more interested in the dominant attacking aspects of their play.
Comparing the key men on the wings
Hulk’s domestic form was what Scolari was hoping that the big man brought to the World Cup. After a disappointing performace in the World Cup opening game, Hulk was dropped to the bench for the next game, against Mexico. The Zenit star is yet to register any contributions towards goals but was lively in the last two games. Hulk’s contribution from the wings will be essential and necessary for Brazil’s below-par strikers to make an impact on the game.
Colombia’s Cuadrado can be a deciding factor in this game. Given that Marcelo is more of an attack oriented full back, the Fiorentina star will look to exploit this and make the most of it. Cuadrado’s known ability to beat the full backs, his pace and final delivery will be needed for Martinez/Gutierrez along with Rodriguez’s run from midfield will be keep Ceasar and the Brazilian defense on their toes, if it all works out.

In terms of being a function of goals, Cuadrado has been more productive than Hulk. Cuadrado has averaged 0.25 goals per game while Hulk is yet to get on the score sheet. The Colombian has created 1.75 chances per game while the Brazilian, although having played a game less (accurately 50 minutes less), has managed 1.33 chances per game. So far, Cuadrado has picked up an assist per game, while Hulk is yet to break his duck.
In terms of passing, Cuadrado wins this battle with ease. Cuadrado has managed 23.5 successful passes per game while Hulk manages 11.33 successful ones per game. The previously spoken directness in attack once again shows as the Colombian has 11.25 forward passes per game while the Brazilian lags behind at 7.67.
Speaking in terms of being a direct threat, Hulk has fared better. Hulk averages 3.33 shots per game while Cuadrado managed 1.75. Hulk has managed 1.67 shots per game from both outside the box as well as inside, while Cuadrado has the 1 shot per game from inside the 18 yard box and 0.75 from outside.
Comparing the two leaders & central defenders
Thiago Silva came in to this World Cup on the back of an excellent domestic season and was considered the more solid man in defense, having a relatively more erratic Luiz alongside him. Silva’s consistency has carried through to the World Cup and has been crucial in getting Brazil out of trouble in plenty of instances. Scolari’s dependence on Silva’s performance could not be emphasized more on.
Mario Yepes, at 38 years old, still managed to flush out solid performances time and time again. Yepes has been in better physical shape but that doesn’t stop him from using his experience wisely. As with age aged defender, positional sense against the lack of pace is a gamble that massively impact the game. The Atlanta defender’s contribution to the game goes far beyond that what is seen on the pitch.

Silva has been dominant, averaging 1.25 blocks per game as compared to Yepes’ 1 block per game. Silva has 8 clearances per game while Yepes has managed 6.67. These stats, on one had show how crucial Silva has been for Brazil, but on the other hand, show that Brazil’s defense has been under attack more often than they would like. Yepes managed 2 interceptions per game while Silva has 1.25 to his name.
Neither of the two have made any defensive errors in the games they have played so for. Let’s not jinx that ( or did we just do that?)
Silva’s distribution forward has been better, averaging 38.50 forward passes per game, as compared to the 21 per game that Yepes managed. Silva also has more backward passes than Yepes per game. From one perspective, this highlights the forced cautiousness that this Brazil side is playing with but from another perspective, shows the aforementioned directness of Colombian play. Silva has managed 41 successful passes per game so far, while Yepes has 21.67.
Silva has also managed 0.75 key passes per game as well 0.75 chances created per game, while Yepes has 0 in both respects.
Yepes’ tackles won per game (2), is better than Silva’s (0.75) but this stat seems to balance out considering he has lost more tackles than Silva. Aerially, Silva has won 2.25 duels per game while Yepes managed 1 per game. As for fouls committed, Silva averages 0.5 fouls per game whereas Yepes has 0.33 per game.
Thank you for reading. You can share this article through one of the buttons below. Do let us know your thoughts in the comments box below.
- Talent Radar Young Players Team of the Week #24: Niklas Sule, Kingsley Coman, and more - March 15, 2016
- Talent Radar Young Players Team of the Week #21: Alireza Jahanbaksh, Jurgen Locadia and more - February 16, 2016
- Talent Radar Young Goalkeeper Rankings: Jack Butland reclaims top position - February 16, 2016


